Executive Summary
ROI is a simple formula on paper: (Value – Cost) ÷ Cost. Getting finance to sign off on it is a whole other story, especially in high-volume hiring where the math gets complicated fast.
Four things drive ATS ROI in high-volume hiring. Focus on these:
- Bad hire avoidance. Reducing early churn pays for tools faster than most finance teams expect.
- External spend reduction. Think agency fees, redundant job boards, and point solutions the ATS can replace.
- Recruiter productivity. This is about recapturing time from manual tasks, which usually translates to more capacity, not headcount cuts.
- Vacancy cost savings. Shaving a few days off time-to-fill across hundreds of open roles adds up quickly.
Here’s the nuance most ROI templates miss: don’t average everything. A company filling 200 warehouse roles and 15 engineering roles in the same quarter has completely different cost assumptions for each. Averaging them hides where the real money is.
This guide gives you a step-by-step model to measure ROI of your ATS with formulas you can copy, a segmented example, and assumption ranges your finance team can sanity-check. It also includes a complete business case template covering your baseline metrics, risks, stakeholders, and a plan for measuring success after you go live.
You don’t need final vendor pricing to build a defensible estimate. With a solid break-even analysis, you can get the ball rolling and refine the numbers as you go.
Key Findings
Use these as your slide-ready bullets. Each one is a planning assumption, not a guarantee, but they’re all grounded in how the math actually works.
- Bad hire cost is roughly 30% of a first-year salary. If you hire 100 people a year at a $50K average salary and 15% churn within 12 months, that’s about $225K in bad hire costs. Reducing that churn by just 20% can pay for most mid-market ATS tools. (For your slide: a simple bar chart comparing baseline vs. reduced bad hire cost.)
- Vacancy cost can be calculated: Annual revenue ÷ FTE count ÷ 220 workdays. For a company with $10M in revenue and 50 employees, each vacant day costs about $909. Shave five days off the hiring time for 50 hires, and you’ve recovered $227K. (For your slide: a line graph showing cumulative vacancy cost against time-to-fill.)
- Model recruiter productivity as recaptured capacity. A recruiter with an $80K fully loaded cost who spends 40% of their time on admin tasks represents $32K of recoverable capacity. The ROI here isn’t about layoffs; it’s about giving them the bandwidth to handle more requisitions without adding headcount. (For your slide: a stacked bar showing time allocation before vs. after.)
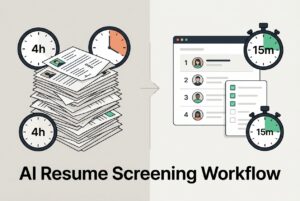
- Volume makes every small inefficiency a big problem. At 500 applications per role, a 10-minute manual review for each resume adds up to 83 recruiter-hours per posting. That’s before any scheduling or follow-ups.
- Segmentation is better than averaging. A simple three-bucket model (e.g., hourly, professional, technical) will almost always show that one role family generates a disproportionate share of avoidable costs.
Methodology
This guide is a practitioner’s framework, not a vendor benchmark report. The model is built to run on your own internal data.
Timeframe: Model the annual impact as your primary view. Also, show the monthly run-rate so finance can see when the investment breaks even.
Internal data you’ll need:
- Hiring volumes by role family (quarterly or annual)
- Avg salary by role family
- Recruiter headcount and fully loaded cost (salary + benefits + overhead)
- Time-to-fill baseline by role family
- Current agency fees, job board subscriptions, and other tool spending
- Early attrition rate (departures within 12 months of hire)
When your data is incomplete (whose isn’t?), use ranges. Document every assumption so leadership can review and challenge them. A model with honest uncertainty is far more credible than one with false precision.
Scope: This guide doesn’t compare vendor pricing. It helps you build the ROI logic and business case structure you can apply to any vendor you evaluate.
What Should “ATS ROI” Mean in High-Volume Hiring (Beyond Cost Per Hire)?
Let’s be clear: cost per hire is a useful benchmark. It is not ROI.
You can get a low cost per hire by slashing your sourcing spend and rushing decisions, but you’ll destroy value with bad fits and constant rehiring. Finance will see right through that. Define ROI the right way from the start.
The ROI formula:
ROI (%) = (Value Created − Total Recruitment Cost) ÷ Total Recruitment Cost × 100
“Value created” isn’t always a hard dollar figure. You’ll need to use proxies:
- Avoided costs (fewer bad hires, lower agency fees, less tool overlap)
- Productivity recaptured (recruiter time returned to actual recruiting work)
- Revenue protected (vacancy cost savings)
Why high-volume hiring changes the math: Bottlenecks hit differently at scale. Manual screening becomes a nightmare. Scheduling delays stack up across dozens of open reqs. A two-day improvement in time-to-fill seems minor for one role. But across 300 hires, it’s 600 recovered workdays. The compounding effect is where you make your case.
Your output should be a range. Present base, best, and worst-case scenarios, plus a payback period in months. This isn’t hedging; it’s what any good finance partner expects. A single number looks like a guess. A range with documented assumptions looks like a real analysis.
What Inputs Do You Need Before You Start (and How Do You Estimate When Data Is Messy)?
You don’t need a perfect dataset. You need a minimum viable one with honest, documented assumptions.
| Input | Where to Get It | If Missing, Use | Notes |
|---|---|---|---|
| # hires/year by role family | HRIS or tracking sheet | Headcount growth + attrition | Split into role buckets |
| Avg salary by role family | Payroll or comp bands | Industry benchmarks (BLS, Levels.fyi) | Use the midpoint of the band |
| Recruiter count + fully loaded cost | Finance / HR | Salary × 1.25–1.4 | Includes benefits, tools, overhead |
| Time-to-fill baseline by role family | ATS / spreadsheet history | Industry averages by role | Segment this; don’t average |
| Agency fees + board + tool spend | Finance / invoices | Pull last 12 months of invoices | Line-item each cost |
| Early attrition / churn within 12 months | HRIS | Industry churn rates by sector | Even a rough estimate is useful |
A note on segmentation: This is the step everyone wants to skip, but it’s where you earn your credibility. Create three role buckets and apply separate assumptions to each:
- Hourly / high-volume: high application volume, lower salary, faster fill time, higher churn.
- Professional / non-technical: moderate volume, mid-range salary, 30–45 day fill time.
- Technical / senior: lower volume, higher salary, longer fill time, higher bad-hire cost.
Weighted averages turn this into noise. Segmentation tells the real story.
Keep your assumptions clean. Put every number, its source, and its range in one “Assumptions” block at the top of your model. Share it with finance before you finalize the presentation. Early alignment prevents late-stage objections.
How Do You Calculate ROI From the 4 Core ATS Levers (With a High-Volume Model You Can Copy)?
Build your ROI as a sum of four distinct modules. Each one is a type of savings. Add them up, subtract your annual ATS cost, and you’ve got your net value, ROI percentage, and payback period.
Total Annual Value = Bad Hire Avoidance + External Cost Reduction + Recruiter Productivity Value + Vacancy Cost Savings
Module 1: Avoiding bad hires and early churn
Annual bad hire cost = Avg salary × 30% × (# hires × early churn rate)
Savings = Annual bad hire cost × % reduction (use 10–20% as a conservative start)
Example: 200 hires/year, $45K avg salary, and 18% churn within 12 months gives you a baseline bad hire cost of $486K ($45K × 30% × 36). A 15% reduction from better screening equals $73K in avoided cost.
Module 2: Reducing external costs
List every single line item: agency fees, job board subscriptions, sourcing tools, assessment platforms. Total them up.
Apply a reduction percentage only where you can justify it. For instance, you can reduce job board spending if your ATS posts to dozens of free boards automatically. Don’t model complete elimination; model a realistic reduction and explain your reasoning.
Example: You spend $120K on agencies and $24K on job boards. If better direct sourcing reduces agency reliance by 25% and board consolidation saves $8K, that’s a $38K reduction.
Module 3: Recruiter productivity (recapturing capacity)
Value = # recruiters × fully loaded annual cost × % time recaptured
Translate this into capacity. “Each recruiter can now handle 30 reqs instead of 20” is much more meaningful to a hiring manager than “saves 6 hours a week.”
Example: You have 3 recruiters at $90K fully loaded. If automation recaptures 15% of their time, that’s $40.5K in productivity value annually.
Module 4: Decreasing time to fill (vacancy cost)
Cost per vacant day = Annual revenue ÷ FTE count ÷ 220 workdays
Cost per vacant day = Annual revenue ÷ FTE count ÷ 220 workdays
Vacancy cost savings = (Baseline TTF − Target TTF) × cost per day × # hires
Segment this by role bucket. The vacancy cost for a senior engineer is far higher than for an hourly logistics role, but both are real costs.
Example: A company with $15M revenue and 60 FTEs has a vacancy cost of ~$1,136 per day. Cutting 5 days off the fill time for 50 professional hires recovers $284K.
Roll-up:
ROI (%) = (Total Annual Value − Annual ATS Cost) ÷ Annual ATS Cost × 100
Payback (months) = Annual ATS Cost ÷ (Total Annual Value ÷ 12)
Run three scenarios and make your base case conservative. If the base case doesn’t break even, the soft benefits won’t save it.
What Does a “Good” ROI Model Look Like for Mixed Roles?
Here’s what it looks like when you put it all together. Notice how a segmented model tells a much clearer story.
| Role Bucket | Annual Hires | Avg Salary | Baseline TTF | Target TTF | 12-Mo Churn | Primary Savings Driver |
|---|---|---|---|---|---|---|
| Hourly / High-Volume | 300 | $35K | 18 days | 12 days | 25% | Vacancy cost + bad hire reduction |
| Professional | 40 | $65K | 38 days | 28 days | 12% | Recruiter productivity + TTF |
| Technical / Senior | 10 | $110K | 55 days | 42 days | 8% | TTF savings dominate |
A blended “average hire” at $55K salary and 35-day TTF looks modest. When segmented, you can see the hourly bucket drives most of the vacancy savings, while the technical bucket justifies a premium sourcing investment. Finance respects this level of specificity because it reflects how hiring actually works.
How Do You Quantify AI and Automation Benefits Without Hand-Wavy Claims?
This is where many ROI cases fall apart. “AI will save time” is a nice thought, not a financial input. Here’s how to make it one.
Screening productivity: Measure the current time spent per resume and the percentage of applications that pass the initial screen. If a recruiter reviews 80 resumes to find 8 people worth calling, 90% of that time is spent on filtering. AI resume screening can shrink that triage time. Model a conservative estimate of time saved per application and multiply it by your volume.
Shortlist quality: It’s hard to measure AI accuracy directly. Use leading indicators instead, like hiring manager satisfaction scores, pass-through rates from screen to interview, and offer acceptance rates. If these improve, your shortlists are getting better, and that has a real impact on downstream costs.
Automation of routine tasks: Think about all the time your team spends on manual follow-ups and status updates. Workflow automation (rules that trigger emails when a candidate moves stages) can eliminate that loop. Measure the time currently spent on this communication and model how much of it automation can take over.
Candidate experience: Track metrics like time-to-first-response, application completion rate, and interview no-show rate. These have real cost implications; a high no-show rate wastes everyone’s time. Faster, automated communication can move these numbers.
Start with two or three metrics you know you can track. Don’t model benefits you can’t measure after you implement the tool.
What Should Your ATS Business Case Include to Get Approved (Template You Can Paste Into a Doc)?
ROI numbers alone don’t get approvals. A complete business case does. Here’s a skeleton you can copy and paste into a document to get started.
1. Executive Summary
Problem: [Describe current state in 2–3 sentences. Mention volume, bottlenecks, and manual work.]
Ask: [Dollar range of investment and timeframe.]
Expected outcomes: [List 3 bulleted outcomes with numbers.]
Payback range: [X–Y months under your base assumptions.]
2. Current State & Pain Points
[Detail hiring volume by role family. Call out specific bottlenecks: screening time, scheduling delays, too many tools, no visibility for hiring managers. Quantify where you can.]
3. Baseline Metrics
[List current time-to-fill by role, cost per hire, agency spend as a % of total hiring cost, reqs per recruiter, and early attrition rate.]
4. Target Outcomes
[State your goals: time-to-fill reduction targets, productivity gains in hours or req capacity, and external spend reduction in dollars or %.]
5. ATS ROI Model
[Attach your four-module model with the assumptions block. Include your base, best, and worst-case scenarios.]
6. Risks & Mitigations
[Use the risk register below and assign an owner for each mitigation.]
7. Stakeholders & Approvals
[List each approver (Finance, IT, Legal, etc.) and their primary concern.]
8. Implementation Plan
[Phase 1: Pilot on one high-volume role family. Phase 2: Full rollout. Include training, documentation, go-live date, and governance.]
9. Measurement Plan
[Define your monthly dashboard metrics, your quarterly business review format, and who owns each metric.]
What Risks Can Kill Your ROI—and How Do You Plan Mitigations Finance Will Trust?
| Risk | Likelihood / Impact | Mitigation |
|---|---|---|
| Low recruiter adoption (shadow spreadsheets return) | High / High | Define required workflows with SLAs; make the ATS the official system of record by policy. |
| Hiring manager non-compliance (slow feedback) | High / Medium | Set SLAs for feedback; include them in rollout training; track feedback cycle time as a key metric. |
| Poor data hygiene | Medium / High | Define what “done” looks like for each pipeline stage; audit data quality monthly. |
| Over-automating without clear process | Medium / Medium | Pilot automation on one role first; document every trigger before enabling it at scale. |
| Under-scoped change management | Medium / High | Assign a dedicated rollout owner; schedule regular office hours for the first 60 days. |
The biggest threat to your ROI isn’t the tool. It’s reversion. People go back to their old spreadsheets when the new system feels harder than the old way. The fix is clarity: defined workflows, required stages, and a process to catch drift before it undoes your progress.
Always pilot on one high-volume role family first. Measure it, fix what breaks, and then expand. Finance trusts pilots because they produce real data, not just projections.
How Do You Present ROI Without Vendor Pricing (Break-Even + Sensitivity) and Still Make a Decision?
You don’t need a final price tag to make a rational case. You just need a break-even analysis.
Frame it in three ways:
- Days-to-fill: How many days does time-to-fill need to drop to cover the annual cost? (Annual cost ÷ cost per vacant day ÷ # hires)
- Recruiter hours: How many hours per week does automation need to save each recruiter? (Annual cost ÷ # recruiters ÷ 48 weeks ÷ hourly rate)
- Agency spend reduction: What percentage of current agency spend needs to shift to direct sourcing? (Annual cost ÷ total agency spend)
If any one of these break-even points seems easily achievable on its own, your investment has a credible floor.
For sensitivity analysis, pick the two or three variables finance will question most (like churn reduction or days saved on TTF). Show the best, base, and worst outcomes for each. Your base case should be conservative enough that leadership can poke holes in it without sinking the whole thing.
Here’s the rule: if the base scenario doesn’t break even on hard-dollar savings alone, don’t try to sell it on soft benefits. If it does break even, you’re ready to start evaluating vendors.
What Should You Track After Go-Live to Prove ROI (and Keep Improving It)?
Your ROI calculation doesn’t stop at go-live. You have to keep measuring to make sure the value sticks.
Monthly metrics:
- Time to first response (by role bucket)
- Stage cycle times (how long candidates sit in each stage)
- Time to fill (vs. baseline, by role bucket)
- Recruiter workload (reqs per recruiter)
- Candidate Source effectiveness (which channels deliver hires)
- Funnel drop-offs (application completion rate, screen-to-interview rate)
Recruiting analytics that can track these trends are crucial. Structured data makes your monthly check-ins credible, not just anecdotal.
Quarterly metrics:
- Early attrition at 90 and 180 days (a proxy for quality)
- Hiring manager satisfaction (a signal for shortlist quality)
- Agency reliance trend (% of hires from direct vs. agency)
- Tool spend trend (are you actually consolidating?)
Governance cadence:
- Assign a metric owner (usually a TA ops lead).
- Monthly: review the dashboard and flag any regressions.
- Quarterly: compare your actuals to the assumptions in your original business case. Adjust where needed.
An ROI model without a measurement plan is just a number that will evaporate. A scorecard with owners is what keeps the savings real.
Appendix
Definitions
- TTF (Time to Fill): Days from job opening to offer acceptance.
- Cost Per Hire: Total recruiting spend ÷ # hires. Not the same as ROI.
- Early Attrition Proxy: % of hires who leave within 12 months; used as a signal for bad hires.
- Vacancy Cost: Revenue impact of a role sitting unfilled. Formula: Annual revenue ÷ FTE count ÷ 220 workdays.
Assumptions Checklist
- Bad hire proxy: 30% of first-year salary ✓
- Workdays per year: 220 ✓
- Role segmentation buckets: Hourly / Professional / Technical ✓
- Recruiter fully loaded cost multiplier: 1.25–1.4× base salary ✓
- Scenarios to model: Base (conservative), Best, Worst ✓
ROI Model Inputs (Copy Into Spreadsheet)
- Annual hires by role bucket
- Average salary by role bucket
- Early attrition rate by role bucket
- Recruiter count + fully loaded annual cost
- Time-to-fill baseline by role bucket
- Time-to-fill target by role bucket
- Annual revenue + FTE count (for vacancy cost)
- Annual agency spend
- Annual job board + tool subscriptions
- Target % reduction per external cost line item
- Annual ATS cost (use range until finalized)